How to Build a CEO Financial Dashboard That Drives Actionable Decisions
Most CEO dashboards drown in data but fail to deliver clear action. You’re not alone if you’re wrestling with cluttered reports that slow down decision-making instead of speeding it up. This guide lays out how to build a financial dashboard that highlights the right KPIs, streamlines your view across entities, and fuels confident, data-driven decisions every time.
Building a CEO Dashboard Framework

A well-designed dashboard serves as your command center, cutting through the noise to present only what matters.
Defining Key Performance Indicators
Start by pinpointing the key metrics that truly reflect your business health. Think of these as your business’s vital signs. Each one should tell you something specific about your operations. For example, if you run a retail chain, you might monitor daily sales and inventory turnover. These indicators give you a snapshot of performance, guiding your next steps. Keep it simple: avoid cramming too many metrics into your dashboard. Choose a handful that provide the most clarity about your business. This focus ensures that you’re never overwhelmed by data.
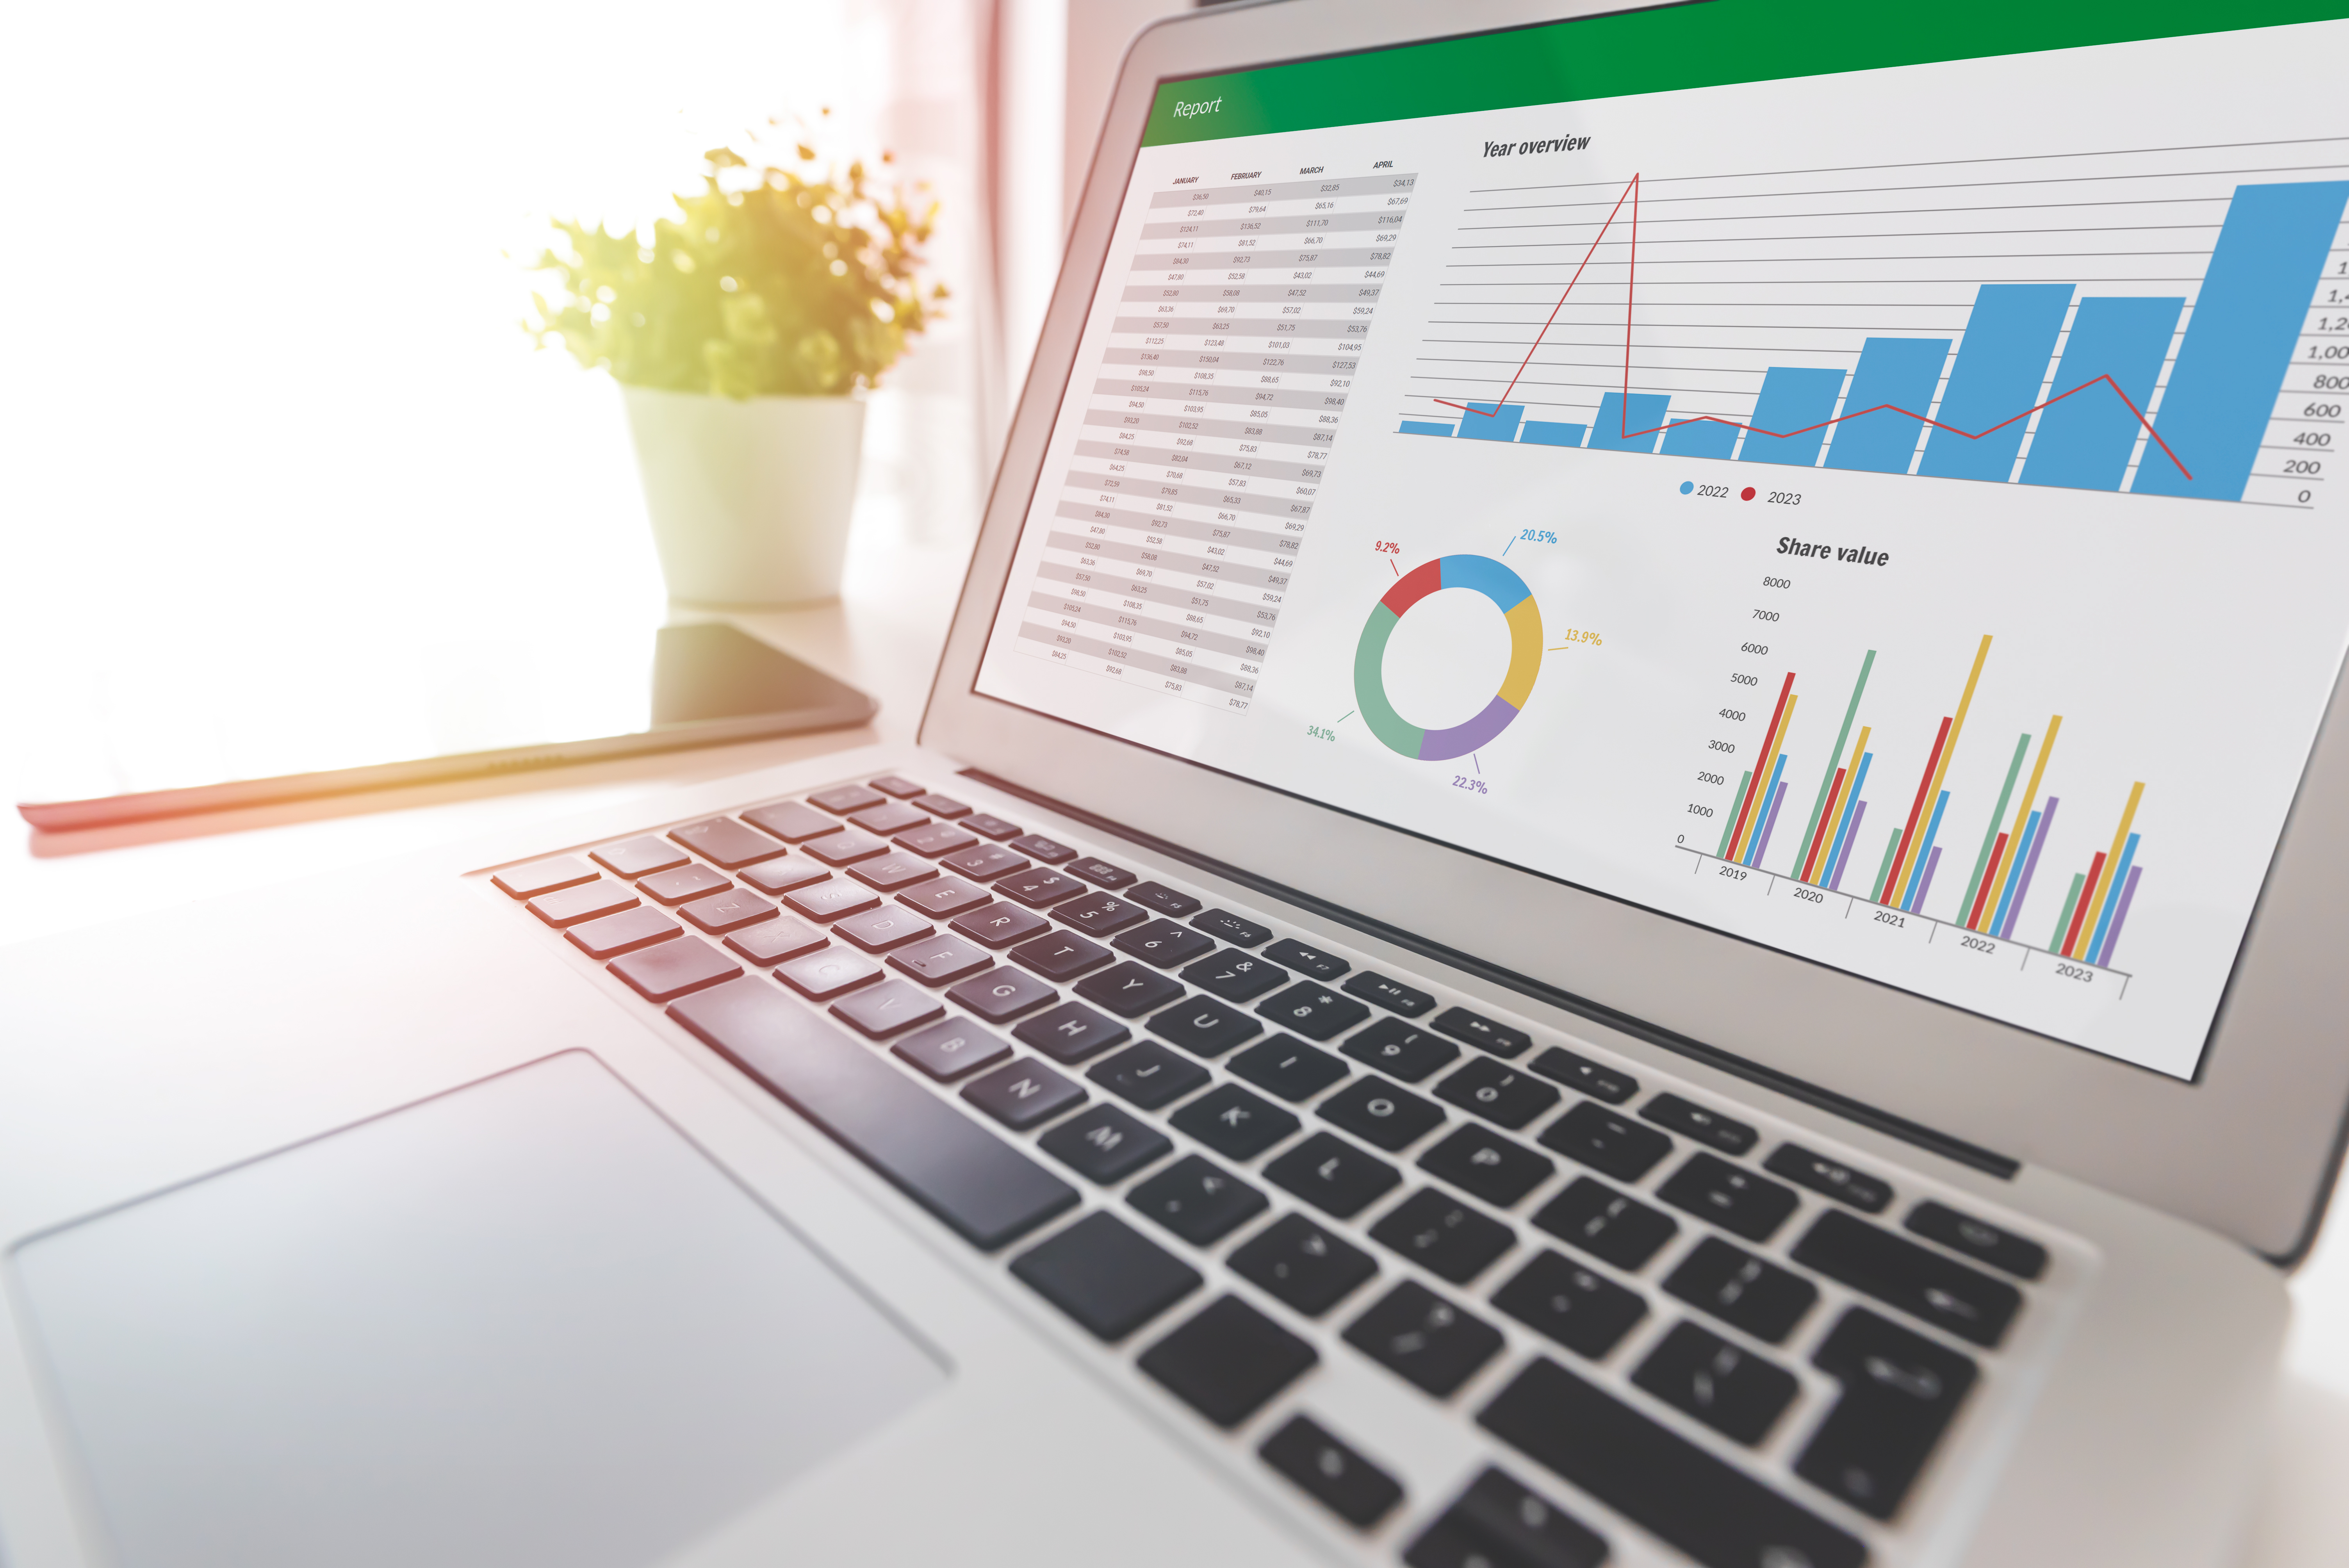
Optimal Dashboard Layout
Your dashboard layout plays a huge role in how you perceive information. Position the most critical data at the top. Use visuals like charts or graphs for quick comprehension. Remember, the goal is to make data interpretation swift and intuitive. Imagine reading a report where everything is jumbled. It would take forever to find what you need. The same holds true for dashboard design. Streamline the layout so that you spend less time searching and more time deciding. Simple tweaks, like grouping related metrics, can make a big difference.
Establishing Reporting Cadence
Consistent reporting ensures you’re always up-to-date. Decide on how often you need updates. For fast-paced industries, daily or weekly might be best. This regularity allows you to spot trends and act quickly. Without a set cadence, you risk missing out on valuable insights. It’s like checking your car’s fuel gauge only once a month. Frequent updates keep you informed and ready to pivot when necessary. Set a schedule and stick to it; your future decisions depend on it.
Leveraging Technology for Real-Time Insights

The right technology can transform your dashboard from static to dynamic, offering insights as they happen.
Integrating Finance Technology Stack
Integrating tools like QuickBooks Online or NetSuite can enhance your reporting capabilities. These platforms offer real-time data that feed directly into your dashboard. This integration ensures that you always have the most current financial picture. Imagine having to manually update figures before every meeting. It’s tedious and prone to errors. Automating this process not only saves time but also improves accuracy. Choose tools that fit seamlessly with your existing systems to make the most of your technology stack.
Automation in Accounting Systems
Automation is a game-changer. By automating routine tasks, you reduce the chance of error and free up time for strategic thinking. For instance, automated invoicing ensures timely billing without manual oversight. It’s like having an extra pair of hands that never tire. With automation, you gain consistency and reliability. Plus, it allows your team to focus on analyzing data rather than collecting it. The longer you delay automation, the more you miss out on these benefits.
Multi-Entity and Consolidated Reporting
If you manage multiple entities, consolidated reporting is crucial. It provides a unified view of all operations, simplifying decision-making. Without it, you might feel like you’re juggling multiple businesses blindfolded. Consolidated reports show the big picture, highlighting areas that need attention. They streamline your view across entities, making it easier to spot trends and make informed decisions. Implement systems that support this level of reporting to keep everything under one roof.
Driving Data-Driven Decisions
Data becomes powerful when it informs action. Here’s how to ensure your dashboard supports decision-making.
Transforming Data into Actionable Insights
Data is only useful if it leads to action. Use your dashboard to identify patterns or anomalies that might need intervention. For example, a sudden dip in sales could prompt an investigation into customer feedback. This process turns raw numbers into strategies. It’s not just about having data; it’s about understanding what it tells you. Encourage your team to dive into these insights regularly. The more you engage with your data, the more valuable it becomes.
Enhancing Profitability Analysis
Profitability is the lifeline of any business. Use your dashboard to track margins and identify cost centers. This insight helps you optimize operations and boost profit. It’s like having a financial compass guiding your every move. Regular analysis allows you to make tweaks that can lead to significant gains. Focus on high-margin products or services to maximize returns. The insights gained here can drive both immediate and long-term strategies.
Implementing Cash Flow and Revenue Forecasting
Forecasting is essential for planning. Your dashboard should highlight cash flow trends and revenue projections. This foresight helps you allocate resources wisely and prepare for fluctuations. Consider it your financial weather forecast. Just as you would plan for rain with an umbrella, use forecasting to prepare for potential downturns. Accurate predictions bolster your strategic planning, ensuring you’re always one step ahead. Prioritize this feature to safeguard your business’s future.
Ready to gain clarity and strengthen your financial operations? Schedule your strategy call today.